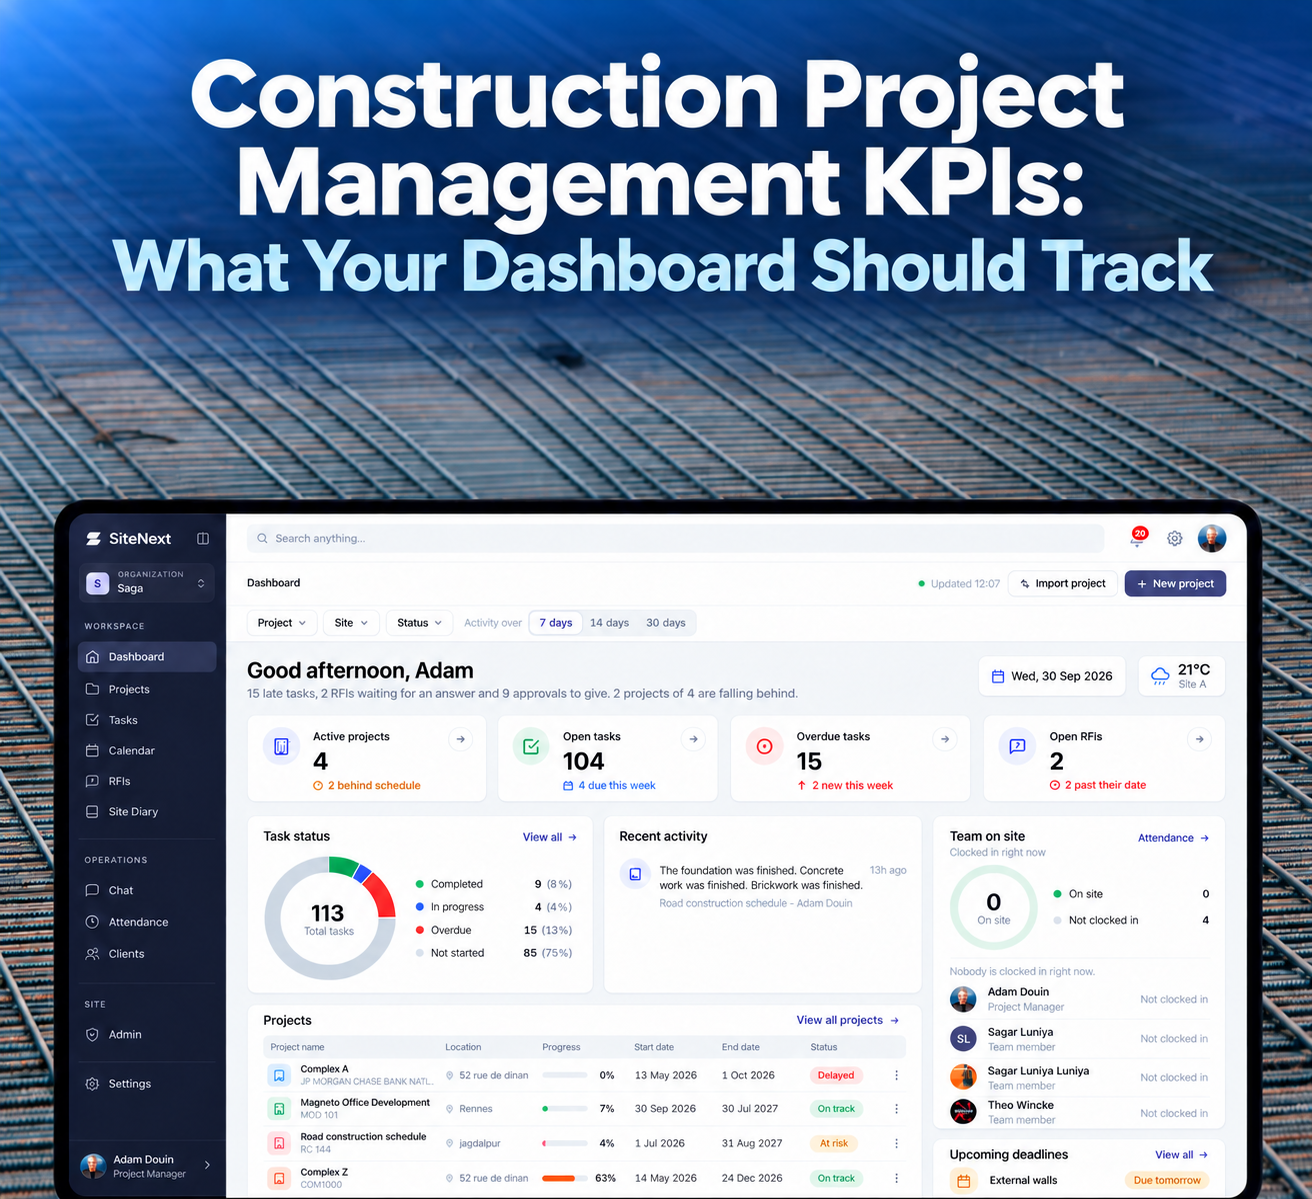
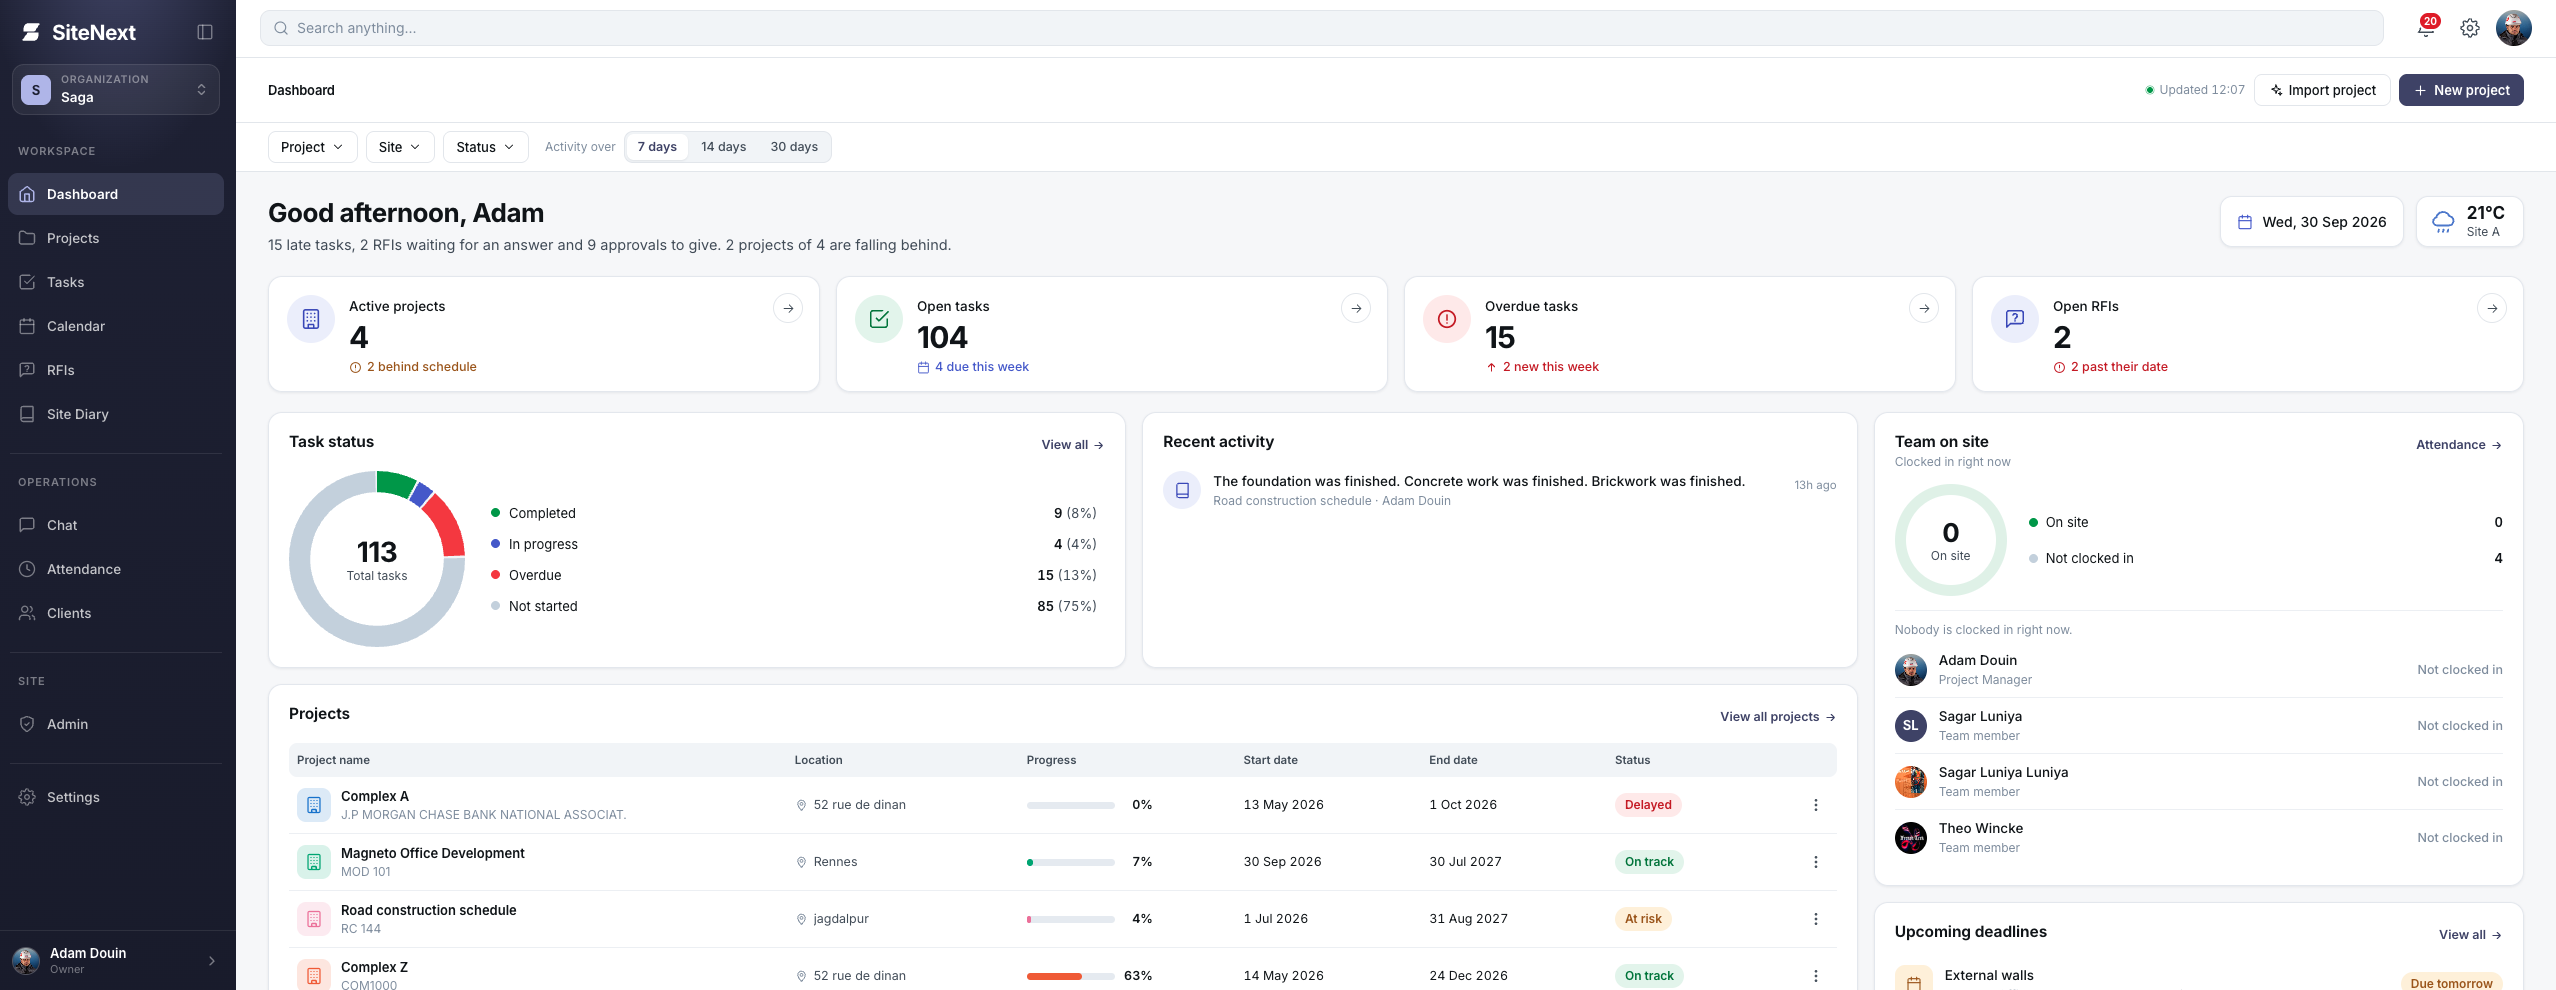
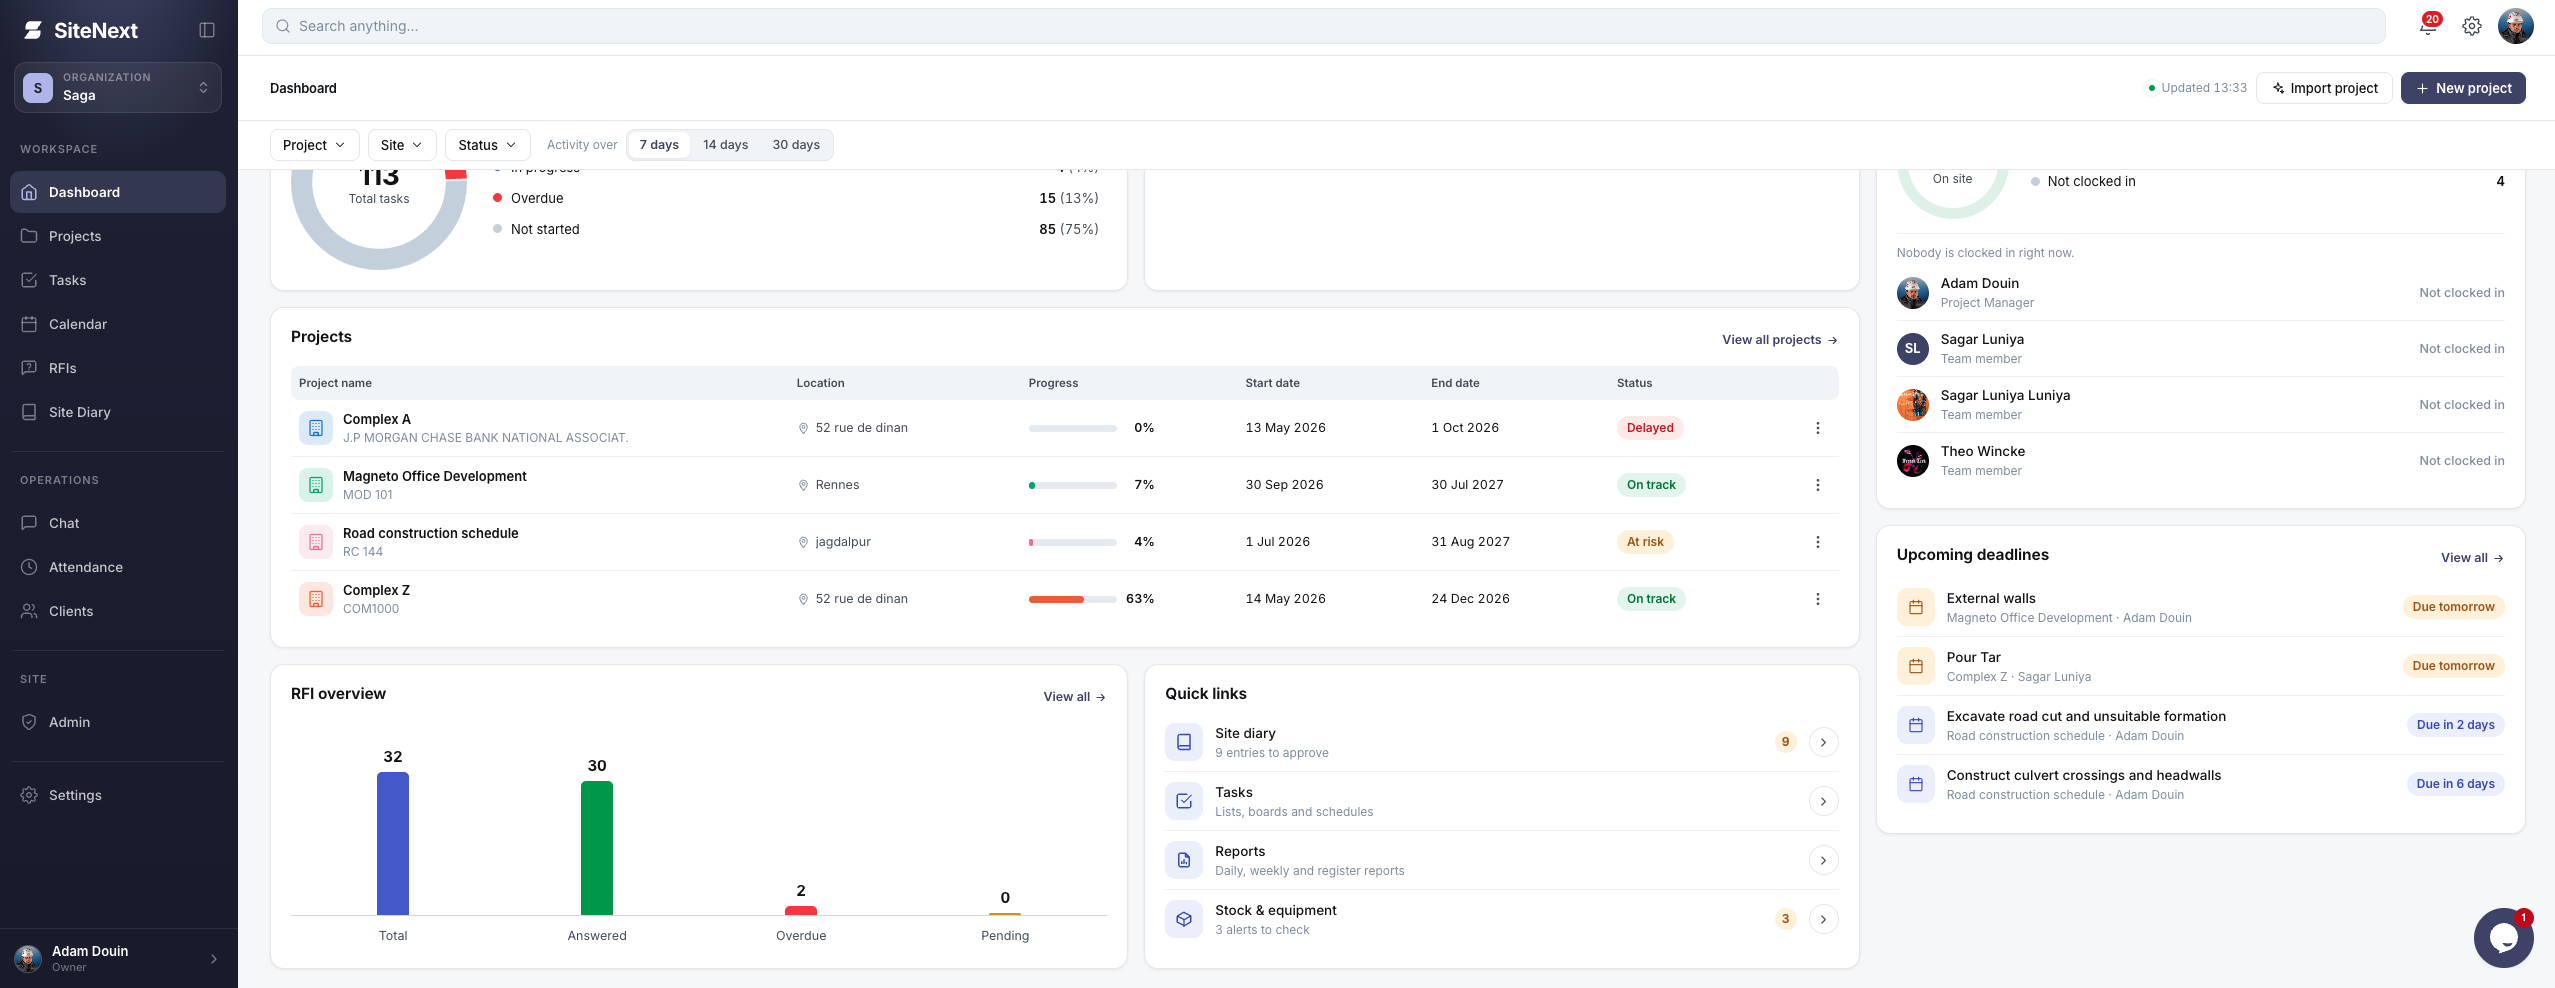
Most construction dashboards fail in one of two ways. They show so many numbers that nobody knows which one matters, or they show so few that problems stay hidden until the project is already late and over budget.
The right construction project management KPIs give you an early warning, not a post-mortem. In this guide, you'll learn which KPIs belong on your dashboard, how to calculate them, and how to keep the data accurate without drowning your site team in paperwork.
What Are Construction Project Management KPIs?
Construction project management KPIs (key performance indicators) are measurable values that show whether a project is on track for time, cost, quality, safety and productivity. Unlike a general status update, a KPI has a formula, a target and a review frequency, so anyone on the team can read it the same way.
A good KPI is:
Measurable: it comes from real site data, not opinion.
Timely: you can act on it this week, not next quarter.
Owned: one person is responsible for moving it.
The 12 KPIs Your Construction Dashboard Should Track
Schedule KPIs
1. Schedule Performance Index (SPI)
SPI = Earned Value ÷ Planned Value. A value of 1.0 means you're on schedule, below 1.0 means you're behind, and above 1.0 means you're ahead. Track it weekly, and investigate anything under 0.95.
2. Percent Complete vs. Planned
Compare actual progress to the baseline programme. The gap between the two is your earliest signal of slippage, especially when it's broken down by trade or work package.
3. Delay Days and Delay Causes
Count the days lost and record why: weather, late deliveries, design changes or access issues. Patterns in delay causes show you what to fix on the next project, and they support extension-of-time claims on this one.
4. RFI Turnaround Time
Requests for information that sit unanswered stall crews and create delay claims. Measure the average days from RFI raised to RFI answered. Many teams aim for a response within 5 working days or less.
5. Cost Performance Index (CPI)
CPI = Earned Value ÷ Actual Cost. Below 1.0 means you're overspending for the work completed. Read it together with SPI: a project can be on time but burning cash, or under budget only because work is behind.
6. Budget Variance
Budget Variance = Budgeted Cost − Actual Cost. Track it by cost code, not just in total, so a small overrun in one area isn't hidden by savings elsewhere.
7. Change Order Value and Volume
Track how many change orders you've raised and their total value as a percentage of the original contract. A rising figure often points to scope gaps or design problems upstream.
8. Rework Rate
Rework Rate = Cost (or hours) of rework ÷ Total project cost (or hours). Rework quietly consumes margin, so track it per trade and per inspection.
9. Snag / Punch List Closure Rate
Measure how many defects are raised versus closed each week. A growing open list near handover is a red flag for both quality and completion dates.
10. Incident Rate (TRIR or LTIFR)
The Total Recordable Incident Rate, or Lost Time Injury Frequency Rate in many regions, normalises injuries against hours worked so projects of different sizes can be compared fairly. Pair it with near-miss reports, which are a leading indicator that tells you about risk before someone gets hurt.
11. Labour Productivity
Labour Productivity = Output (e.g. m² of block laid) ÷ Labour hours. Compare actual against the estimate for each trade to see where crews are running faster or slower than planned.
12. Attendance and Manpower on Site
Planned versus actual headcount, by trade, by day. If the programme assumes 20 operatives and 12 turn up, your SPI will show it two weeks later, and your attendance data shows it today.
Leading vs. Lagging Indicators: Build a Balanced Dashboard
Cost variance and incident rates are lagging indicators. They tell you what has already happened. RFI turnaround, manpower levels, near-miss reports and open snag counts are leading indicators, and they tell you what's likely to happen next.
A strong dashboard mixes both. If your dashboard has only lagging KPIs, you'll always be reacting. Aim for roughly one leading indicator for every lagging one.
How to Design a Construction KPI Dashboard That People Actually Use
Keep it to 8–12 metrics. More than that and the important numbers get lost.
Show status at a glance. Use simple green, amber and red thresholds, such as SPI above 0.95 green, 0.85–0.95 amber and below 0.85 red, so a manager can read the state of a project in seconds.
Separate the audiences. A site manager needs daily manpower, delays and snags. A director needs SPI, CPI and safety across the portfolio. A client wants progress, milestones and issues. One data source can serve all three if the views are role-based.
Set a review rhythm. Review site-level KPIs weekly and portfolio KPIs monthly. A KPI nobody reviews is just decoration.
Where the Data Comes From (and Why It Breaks)
The biggest problem with construction KPIs isn't the formulas. It's data quality. If site diaries are filled in late from memory, attendance is tracked on paper and RFIs live in email chains, your dashboard is only as reliable as the last person who remembered to update a spreadsheet.
Accurate KPIs depend on capturing information at the source, on site, as work happens:
Daily diaries record workforce, weather, deliveries, delays and progress.
Timestamped, GPS-tagged attendance shows who was actually on site.
Task and RFI status shows what's blocked and for how long.
Photos give visual proof of progress and quality.
When those inputs are captured digitally, the KPIs calculate themselves from real data instead of from end-of-week guesswork.
Turn Your KPIs Into Reports Clients and Directors Trust
A KPI only creates value when the right people see it at the right time. That's where reporting comes in.
With SiteNext's construction reporting features, you can turn the data your team already records on site into professional reports in seconds. SiteNext generates:
Daily site and weekly progress reports covering completed work, workforce, site conditions and key events
Monthly project reports for directors and clients
Task, RFI and delay/issue reports that show outstanding items and overdue actions
Attendance and site diary reports with photo-verified, GPS-tagged records
Photo reports that give a visual record of progress
You can filter by any custom date range, project or period, then export to PDF, Excel or CSV, or share by email in a click. That means your payroll team gets attendance in Excel, your client gets a clean PDF, and your directors get a monthly summary, all from the same source data and a single reporting dashboard.
Because reports draw on the same diaries, tasks and attendance records your team fills in during the day, there's no Friday-afternoon scramble to rebuild the numbers. See how SiteNext reporting works or join the waitlist for early access.
Common KPI Mistakes to Avoid
Tracking too many metrics. Pick the few that drive decisions.
Measuring without a baseline. A KPI needs a plan or target to compare against.
Relying on lagging indicators only. You'll always find out too late.
Inconsistent definitions. Agree what "complete" means before you measure completion.
Reporting without action. Every red KPI should trigger a named owner and a next step.
Quick-Reference: Construction KPI Summary
Category | KPI | Review frequency |
|---|---|---|
Schedule | SPI, % complete, delay days, RFI turnaround | Weekly |
Cost | CPI, budget variance, change orders | Weekly / monthly |
Quality | Rework rate, snag closure rate | Weekly |
Safety | TRIR/LTIFR, near-misses | Daily / monthly |
Productivity | Labour productivity, manpower on site | Daily / weekly |
Frequently Asked Questions
What are the most important KPIs in construction project management?
The core set is Schedule Performance Index, Cost Performance Index, RFI turnaround time, rework rate, safety incident rate and manpower on site. Together they cover time, cost, quality, safety and productivity.
How often should I review construction KPIs?
Review site-level KPIs weekly, safety and attendance daily, and portfolio-level KPIs monthly.
What is a good SPI or CPI for a construction project?
A value of 1.0 means on plan. Most teams treat 0.95 and above as healthy and investigate anything below that.
How do I track construction KPIs without spreadsheets?
Capture data digitally at the source through site diaries, attendance, tasks and RFIs, then generate reports automatically. A platform like SiteNext keeps everything in one place, so your KPIs come from live project data instead of manual re-entry.
Conclusion
The best construction dashboard isn't the one with the most charts. It's the one that tells you, early and clearly, whether time, cost, quality, safety and productivity are on track. Start with the 12 KPIs above, balance leading and lagging indicators, and capture your data on site so the numbers can be trusted.
Ready to turn site data into reports your team and clients rely on? Join the SiteNext waitlist.